A guide to creating data-driven schools
While this tech-rich world of ours can feel overwhelming at times, we do have access to more data than ever before. The question now becomes, “What do we do with all this data? How do we become a data-driven school?” You may have heard the expression that you can be data rich, but insight poor. Schools juggle many variables when it comes to supporting individual students’ academic journeys, so how can administrators and educators lean on school data to make more strategic, informed, and personalized decisions?
What is the role of data in schools?
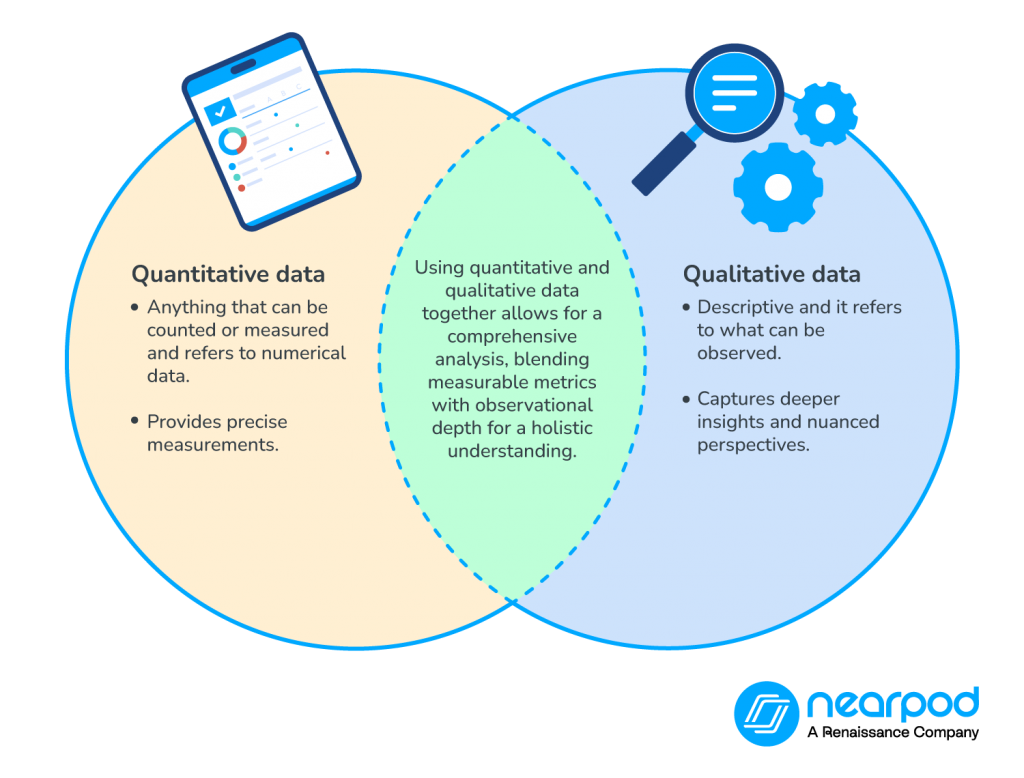
When we speak of data, we refer to both quantitative and qualitative data, and in education, there is a happy medium in relying on both. Teachers gather qualitative data throughout any given school day—for example, how is a child acting and what are their responses (verbal and nonverbal)? As an administrator, you may look for such open-ended feedback about school culture and climate from all of your constituents: staff, students, and families. Then, both school administration and classroom teachers lean on quantitative methods such as attendance, test scores, or survey results, which are measurable, to identify patterns and trends to better inform overall operations, daily instruction, and student outcomes.
What are the benefits of having a data-driven culture in schools?
There are many! When data-driven instruction becomes the “norm” or routine, timely reflection by all will promote equity and student performance. With such school data analysis, teachers can change their strategies accordingly and employ targeted interventions as needed to be more effective. When your students witness their own progress toward goals, they become more engaged and motivated. Such evidence-based instruction then leads to better student outcomes.
Plus, as a data-driven school leaning on both qualitative and quantitative data, you will have more input and intel to support your decision-making processes. Additionally, you will have more evidence to support your recommendations and choices, leading to more buy-in and ownership from others. Data-driven decisions aren’t driven by one opinion or one point of view, so you can bolster more consensus and collaboration across your stakeholders in moving forward with next steps within an action plan. Such responsive measures will help you create a positive school climate where all are on board with the school’s mission and your leadership style.
Why is data-driven decision making in schools important?
As a school leader, you may gather quantitative and qualitative data from additional stakeholders such as parents and family members, as well as certified and classified staff members. There are many stakeholders involved in developing a positive school culture. As we know, a school’s culture is just as important as its test scores or ranking. While you may have personal beliefs, intuitions, and assumptions, make it a habit to check those against what the data is telling you, so that you refine, redesign, and react in the most supportive manner. With data-driven decisions, you will have a better understanding of your audiences, a better grasp of the quality of the learning experiences your school offers, and a better sense of control when it comes to the direction of your school. So, in addition to efficiency, you can better promote efficacy. You can model how to implement data-driven practices and decision making for students, teachers, staff, and families, instead of just relying on “how it’s always been done.” In doing so, you will model how active participation can lead to continuous school improvement.
The power of Nearpod for data-driven schools
Nearpod is a popular platform for schools to use with students when it comes to instruction and assessment. The flexibility and interactivity make it an engaging learning tool for students, and educators receive real-time data and robust analytics at the individual and group level with each interaction. 86% of customers say Nearpod helps evaluate student performance. Nearpod transforms passive lessons into active and participatory learning experiences, and educators collect valuable learning data that helps them make more informed decisions when it comes to differentiation and individualization.
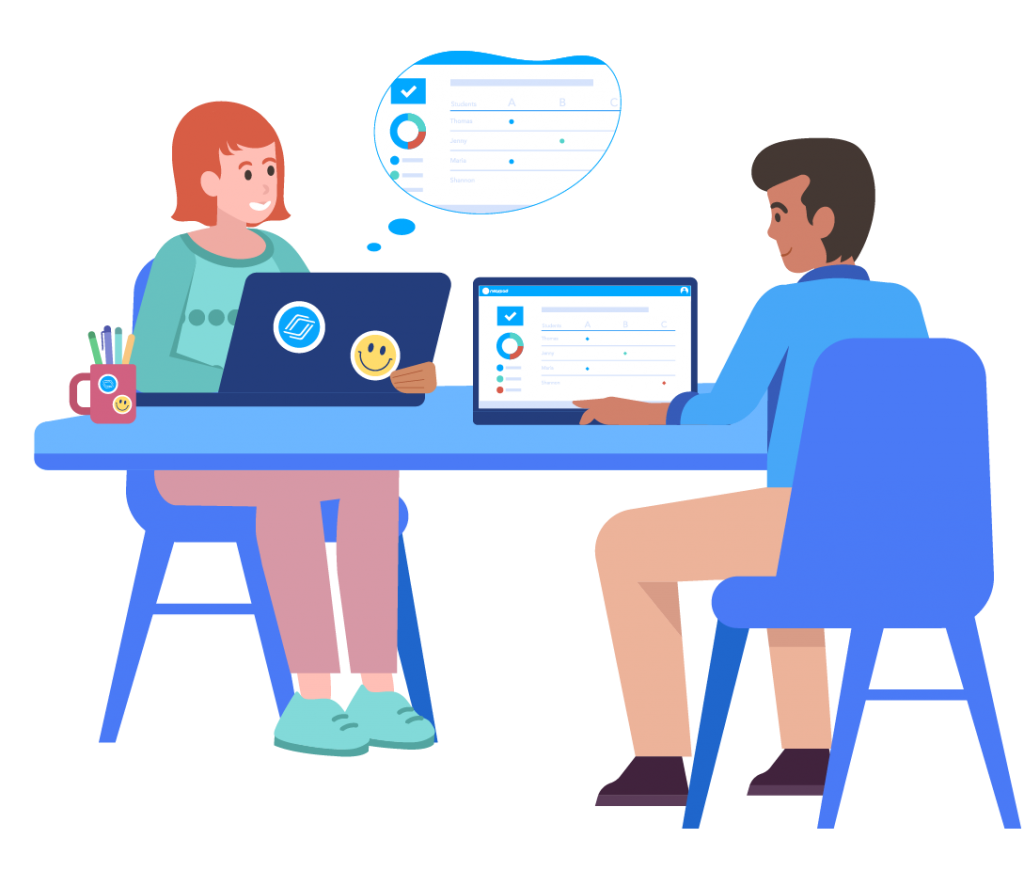
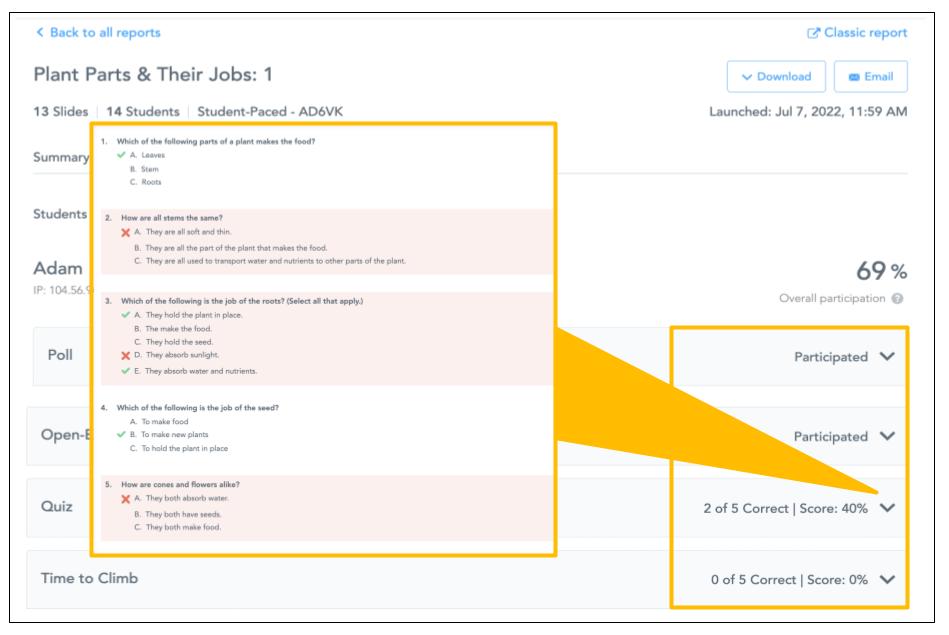
As an administrator, you can review students’ post-session reports from Live or Student-Paced sessions and even download them in PDF or CSV format. Together, you and your educators can look at specific lessons for data patterns and trends not only for individuals but across groups over time, which may help with horizontal as well as vertical planning. Additionally, you can use Nearpod to create surveys to gather feedback. Consider how you might use Nearpod’s multimedia presentations to share results and insights in a visually rich and digestive manner. Simply upload existing PowerPoint presentations, Google Slides, PDFs, images, videos, or other resources to a new lesson. You could share it with individual stakeholders or use it in Group Presentation mode with a larger group.
Foster a love of learning in every student with Nearpod. Teachers can sign up for free below to access and create interactive lessons. Administrators can schedule a call with an expert to unlock the full power of Nearpod for schools and districts.
A guide to creating data-driven schools
1. Be flexible
There is the old adage that teachers write their planbooks in pencil—and whether they use an eraser or a delete button, all educators must remain nimble and ready to iterate, as the formative data they receive throughout a day might change the instruction for the next day or even the next block! Such is the catch-22 of data-driven instruction. While data is truly helpful for planning, those plans most likely will remain in flux if one is constantly referring to that data.
As the administrator, you, too, need a similar flexible mindset, as school data can lead you down surprising or uncharted paths. Be sure to share your strategy for building a data-driven school with staff and families. Then, you all will have trust in any deviations from the “norm,” knowing that such changes or shifts are warranted to best serve students. A focus on analyzing school data will lead to more personalized learning. Students will benefit from real-time, immediate feedback, teachers can clear up misconceptions or plan to reteach concepts in the moment, and whole classrooms can progress toward meeting standards without any “surprises” at end-of-unit or end-of-semester testing.
“Nearpod is one of the best tools to measure student progress and attainment in each lesson. It’s truly a data-driven classroom when you have Nearpod enhanced student engagement.”
Teacher, Alabama
2. Ask “good” questions
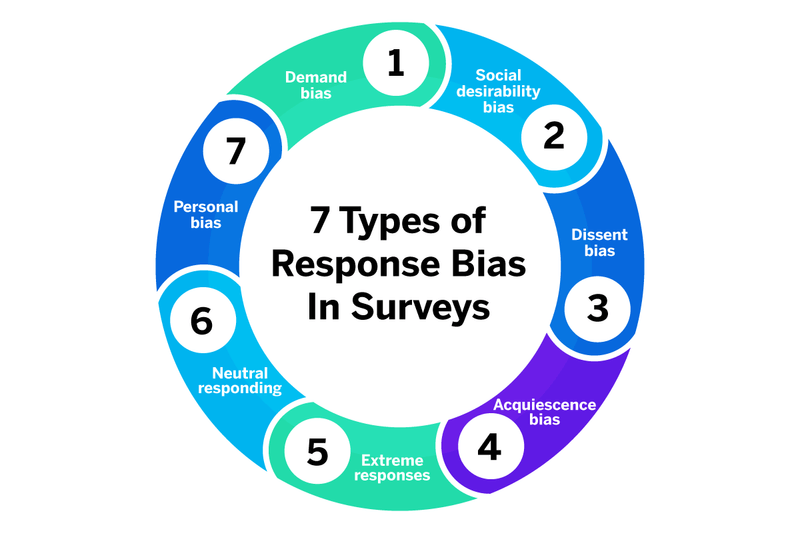
It sounds elementary enough, but be thoughtful in how you frame questions to your stakeholders, so that you can get targeted responses while ensuring that they remain as unbiased as possible. What makes a good question? While it will depend on your intended audience, strategic questions should be clear and focused, authentic and relevant, and applicable and attainable (aka, able to be answered). Whether it is a student, a staff member, or a family member, we want to invite them in to share what they know and believe. The wording of questions and even the order of questions can affect input, especially when you are trying to determine change or progress over time.
When gathering feedback through surveys, such as when evaluating school climate, consider survey biases as well. Try to wear a designer’s hat at times, and try A/B testing or split testing—where you separate your audience into two random groups and share two different versions of content (e.g., copy, quiz, lesson) at the same time to figure out which performs better. As American author Ursula K. Le Guin said, “There are no right answers to wrong questions.”
With Nearpod, you and your teachers can create surveys and assessments using the Quizzes and Open-Ended Questions. You can even ask for feedback in graphic form via the Draw It tool (especially helpful for ELLs). You can create one-slide presentations or multi-slide presentations, which will allow you to consider how to design for the reading levels of your audience. Last but not least, Nearpod’s Immersive Reader will enable those with special needs or language support needs to partake and participate.
3. Look for patterns
Let’s start with the quantitative data—the raw numbers that schools compile in spades. This data can be demographic breakdowns, survey data, LMS activity, and test scores, just to name a few. It is often helpful to start with summaries of such data in a visual format to begin looking for patterns and trends. What is important is not to jump to conclusions but to gather all stakeholders’ questions about what they are seeing, so you can then dive deeper. Adopt a researcher’s mindset and cross-reference your data sources and sets. Filter and segment your data to better understand how different populations are affected. Finally, determine how best to extrapolate and summarize key findings to share with your main audiences.
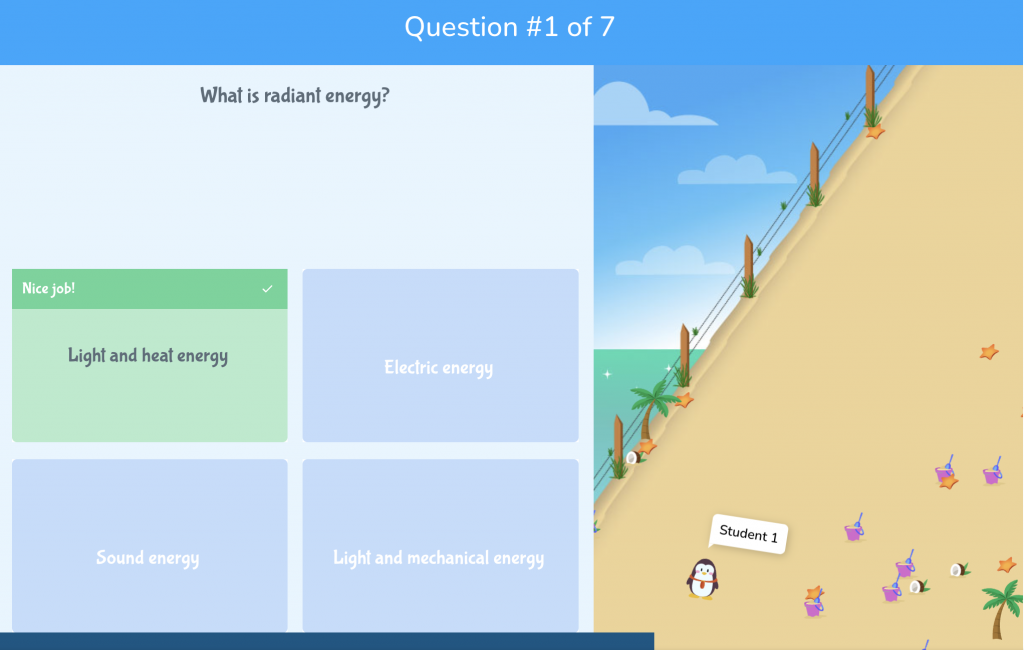
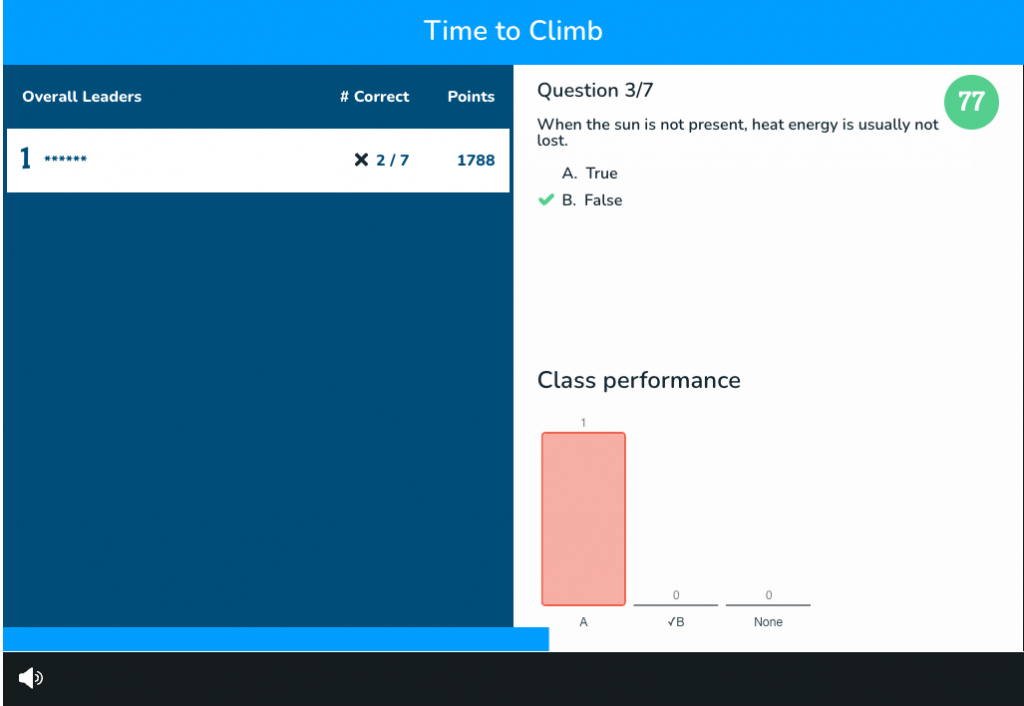
Within Nearpod, your teachers can use activities like multiple-choice Quiz questions, Drag & Drop, Fill in The Blanks, Matching Pairs, or Time to Climb to gather data that provides indicators about a student’s comprehension and proficiency when it comes to a particular topic or skill. These activities can be used prior to teaching, providing a baseline of diagnostic data. They can be used during a lesson to provide practice and illustrate progress. Or they could be used for summative assessment to gauge mastery. These results can be seen in real time via the students’ post-session reports. The flexibility that Nearpod provides through its lesson design tools means that teachers can take a customized approach to what their students need most.
4. Actively listen to the data
Listen might sound like a funny word choice when we’re talking about data, but in analyzing qualitative data, we often need to employ our Spidey senses to actively “listen” to nonverbal cues. Listen to the data—follow those breadcrumbs. For instance, within a classroom setting, how are kids acting, where is their attention focused, and what does their body language say about their readiness to learn or level of engagement? When it comes to surveys or assessments, what do the open-ended questions and responses hint at? Take a close look and pay attention to word choice and tone. Consider how you can take a design thinking approach, and follow up the first round of feedback by asking five “WHY?” questions to drill down a bit more on specific needs. Questions with little feedback warrant as much scrutiny as those with a lot of feedback.
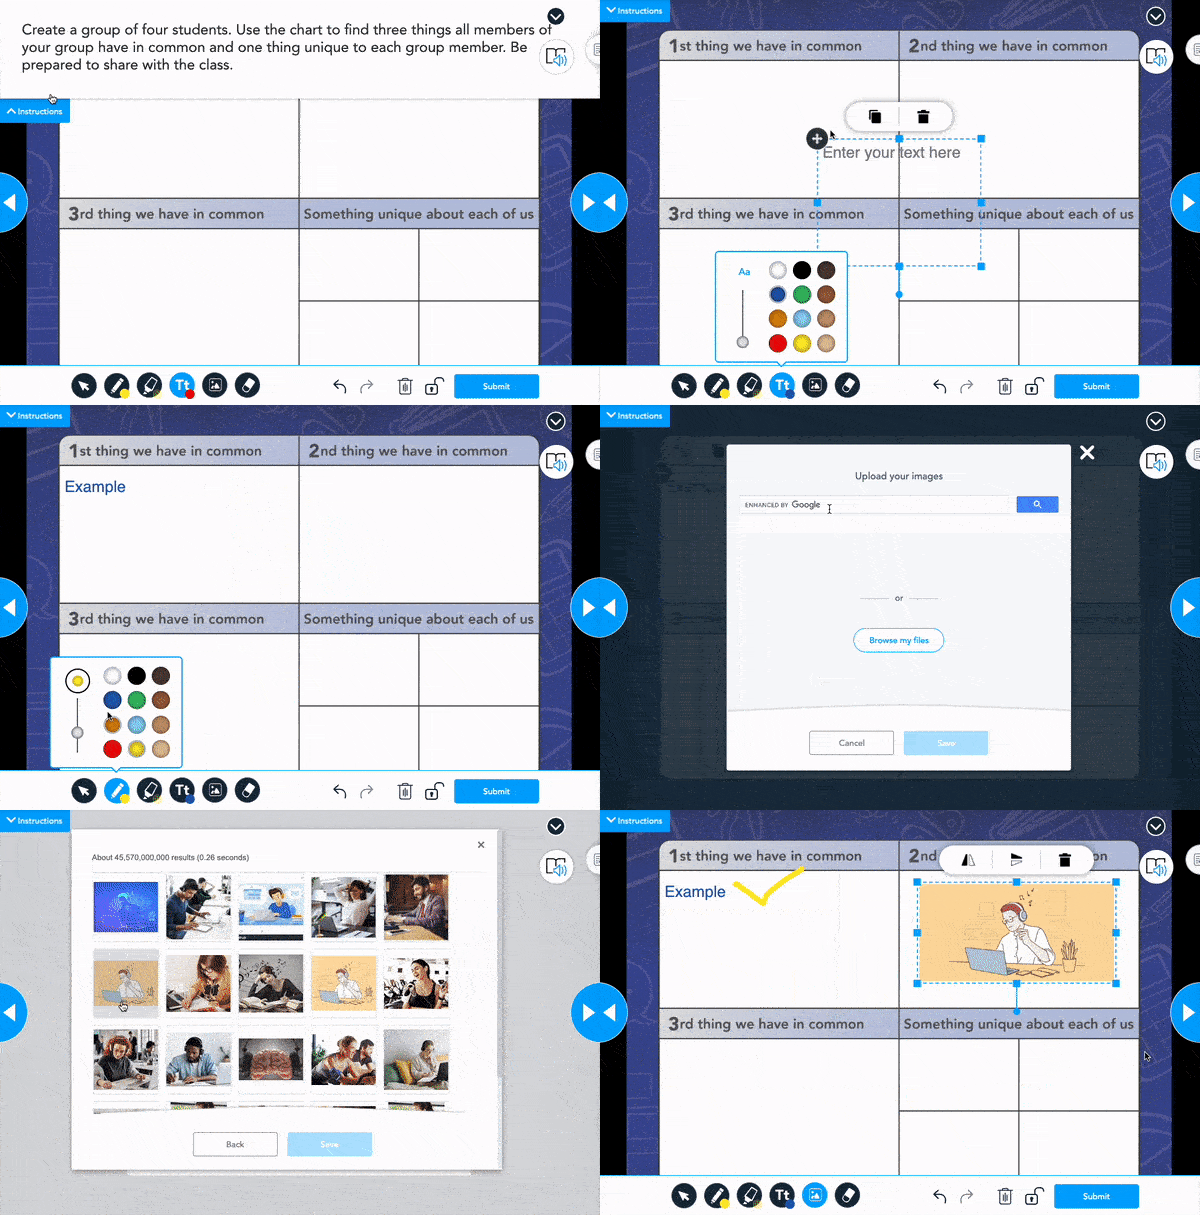
Remember that Nearpod has many activities that allow for student expression that falls more in the qualitative realm. There are several interactive activities such as Open-Ended Questions, Draw It, Audio Recordings, and the ever-popular Collaborate Board, where you can gather more candid and authentic responses. And don’t forget just how easy it is to add reference media—such as an image, photograph, video, website, or audio recording—to a lesson as you create your questions and prompts. These features could benefit other stakeholders as well, such as colleagues and families, if you were to use them in surveys to elicit more comprehensive feedback.
5. Tailor your feedback
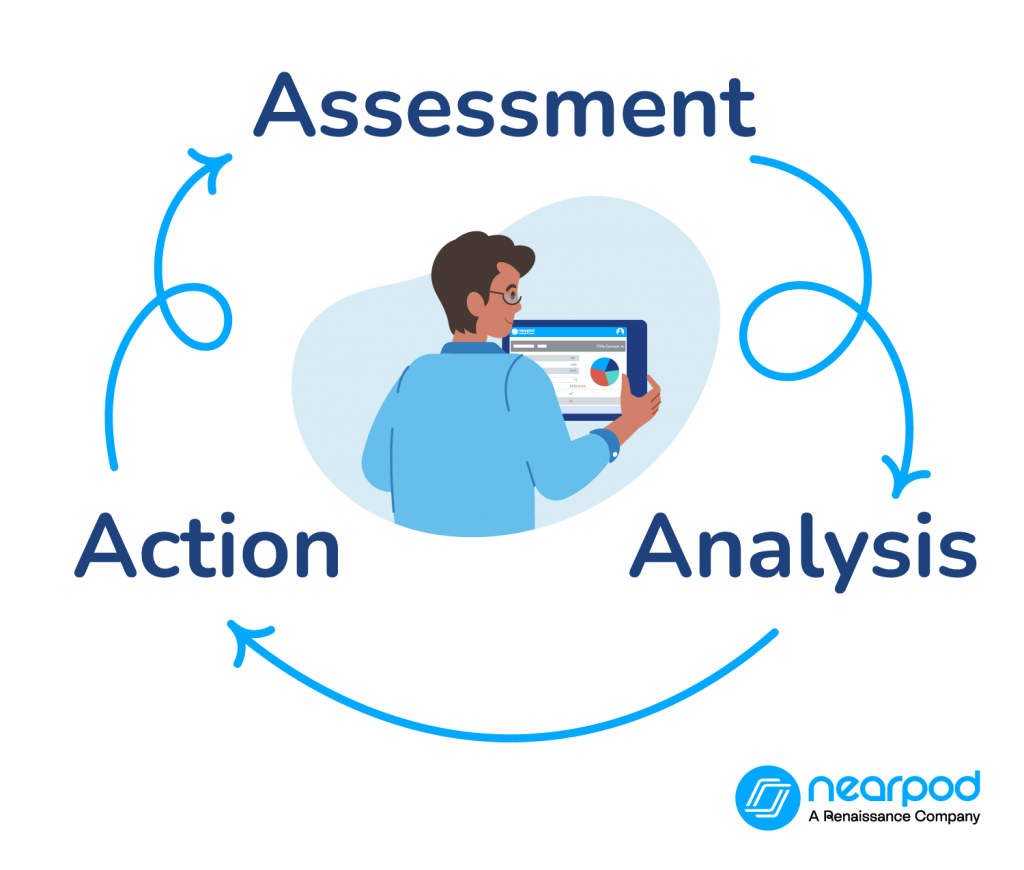
An important part of integrating data-driven instruction in schools is providing targeted and immediate feedback. After asking questions (assessment), gathering intel (analysis), and leaning into findings (actions), you should tailor your feedback to the individual. This tip applies regardless of the audience, young or old. One way to make feedback valuable and helpful is to remember the acronym SUGAR, which stands for:
- SMALL: Feedback is small so that it can be addressed and acted upon quickly.
- URGENT: Urgent feedback prioritizes and addresses the most pressing concerns first.
- GENERALIZE: Generalized feedback focuses on a pattern of errors versus just one.
- ACTIONABLE: This feedback has actionable, clear, and observable next steps.
- RETURN: Remember to return or follow up with the individual to keep the conversation going.
As Mary Poppins sang, “A spoonful of sugar helps the medicine go down …” so keep those points in mind when personalizing and delivering feedback as part of your data-driven decision making in education and professional learning.
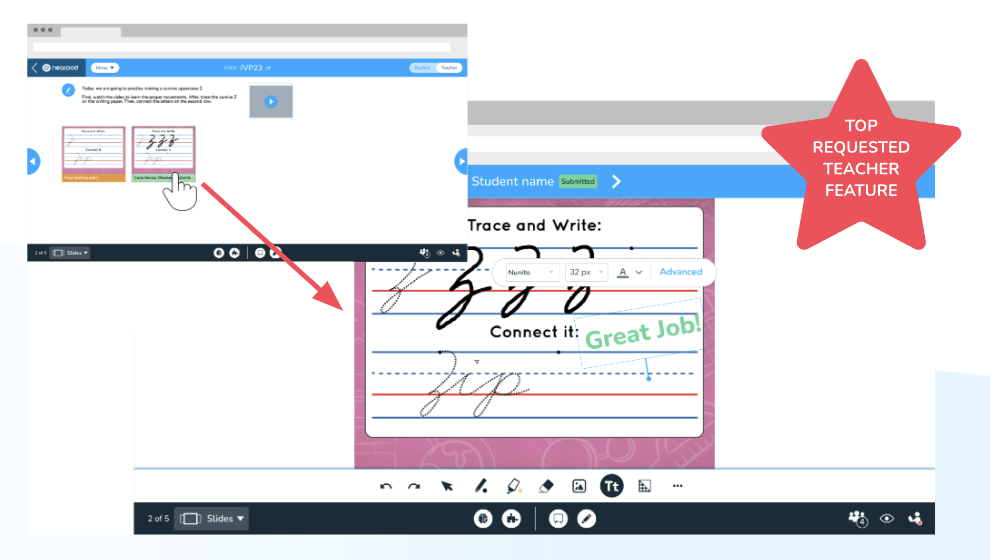
For teachers, Nearpod’s Live Teacher Feedback can help provide a continuous feedback cycle for students in the classes. They can add stickers or annotations to students’ work. Screenshots of their feedback will appear in each student’s report, giving students a real-time response and providing them with a running record of exchanges. Your educators can share these reports containing the feedback with their students’ homes, too, so that families can continue to support their kids continuously alongside the school.
6. Empower others
Ultimately, student data can help empower the end users—the students! Data can paint powerful pictures for students so they can see how they are moving toward their goals. Students can monitor their own progress and identify where they might need more support. By sharing such data collection with students, you’ll help them become more independent, confident, and responsible. They may feel more motivated to engage in self-exploration and self-expression, all of which can lead to better student outcomes.
In taking a whole-child approach to education, consider how the 21st Century Readiness Program can be woven throughout the grades. CASEL’s social and emotional learning (SEL) wheel highlights five competencies: self-awareness, self-management, social awareness, relationship skills, and responsible decision making. Research indicates that SEL leads to improvements in classroom management, academic achievement, healthy relationships, career preparedness, and mental health. Equip your students with essential life and social emotional learning skills that will help them inside and outside of your school’s four walls.
Today we used @nearpod for a digital citizenship conversation about selfies and our digital footprint! #AllenOlympics @allenelem @MrMcDaniel13 @ms_broker @McGee_IC pic.twitter.com/7FIdeGJsHN
— Kelsey Storm (@MrsStormsSquad) March 20, 2024
Administrators can schedule a call with an expert to explore Nearpod’s 21st Century Readiness Program and unlock the full power of Nearpod for schools and districts.
7. And remember, data isn’t absolute
Educators know this better than most, but nothing happens in a vacuum. So, while data is super valuable and helpful, educators still need to stitch together the various types of data, informal and formal, when forming opinions and making decisions. Remember to think outside of the box and put your ear to the ground when gathering insights and drawing conclusions. Question! If you haven’t yet read Glenn Doyle’s essay, Share This With All the Schools Please, do so to illustrate how one teacher gathered data but used the results in an unexpected way.
“The art and science of asking questions is the source of all knowledge.”
Thomas Berger, American novelist
Take the next steps for a data-driven school
Data-driven schools have the potential to leverage strategic decision making to ensure a more collaborative and community-based approach to school improvement. Data can take the “I” out of top-down edicts and help rally the troops when it comes to bolstering school morale and energizing all stakeholders. You can be a model of data-driven leadership in schools by remembering that when it comes to data and tech in general, we need to acknowledge that while numbers are directives, we as humans hold the power of empathy. We need to take an active approach to seeing the whole picture in education for true student achievement. By doing so, we will ensure that we keep using such a lens when we assess, evaluate, and look forward, all while humanizing education.
Foster a love of learning in every student with Nearpod. Teachers can sign up for free below to access and create interactive lessons. Administrators can schedule a call with an expert to unlock the full power of Nearpod for schools and districts.

Darri Stephens is a dedicated LX (learning experience) designer, passionate about creating quality content and programs for kids, families, and educators. With MAs in Education from both Harvard and Stanford, and work experience at best-in-class ed tech organizations including Wonder Workshop, Nickelodeon, and Common Sense Education, she is steeped in the design thinking process and committed to agile and iterative project management, which has resulted in multi-award-winning programs and products.
