How to use Nearpod’s lesson reports for teachers
As an educator, my top priority was always ensuring that my students truly understood what I taught. If they didn’t grasp the material, it meant I needed to adjust my approach and teach it again!
As a newbie teacher in the early ‘90s, this approach was just a guess on my part, and not even a fully educated one, if I’m being honest. As a more seasoned teacher in the early 2000s, I better understood teaching and learning and was able to make better guesses.
But now, schools are becoming more data-driven—moving beyond just collecting information to using it to guide instruction. This means you no longer need to guess what approach to use, like I did. It also means you have to find the right balance between qualitative insights, like student engagement, and quantitative metrics, like assessment data.
With technology, and Nearpod specifically, I can turn data into action, ensuring every student is on the path to mastery.
Nearpod’s unique instructional format gives teachers insight into student learning through Nearpod’s reports. Let’s explore this resource and how you can use reports to support student success.
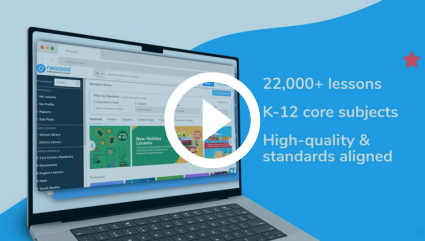
New to Nearpod? Teachers can sign up for a free Nearpod account below to access these resources, interactive activities, and engaging lessons. Administrators can schedule a call with an expert to unlock the full power of Nearpod for schools and districts.
What are reports in Nearpod?
Reports are broken into three sections: the summary, the activity report, and the student report. All three types of reports are automatically generated for every Live and Student-Paced lesson, video, or activity you launch in Nearpod. Each report is tied to your unique lesson code or link, capturing a time-stamped record of student participation and responses.
These reports provide teachers with valuable data, including:
- Student responses to questions, quizzes, polls, and interactive activities
- Engagement metrics such as participation rates and activity completion
- Performance insights that highlight correct and incorrect answers and open-ended responses across the class
Generating reports this way can be incredibly valuable for any teacher who teaches the same lesson to multiple groups of students. An example of this might be a science teacher who sees multiple students at different times of day. Your report will show the launch time, so you will know which group was in 1st period and which group was in 7th period; even this small piece of information can impact how you interpret the data.
Teachers can use these reports to reflect on student understanding, identify misconceptions, and tailor future instruction. Reports can also be shared with administrators, MTSS committees, or intervention teams to support data-driven decision-making. Available on the Nearpod platform, reports can be viewed online or downloaded as a PDF or CSV for further analysis and collaboration.
How to find reports in Nearpod
Once you’re done teaching, it’s easy to find and access a lesson’s reports.
First, find which lesson you want to review the reports for. Use the three-dot menu option in the top-right corner of the specific lesson tile and select “Reports” from the drop-down menu. This will open all the reports generated from that specific lesson, both live and Student-Paced. They will be in reverse chronological order.
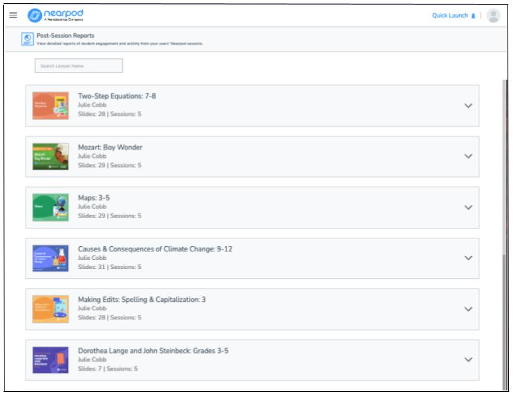
If you do not have a specific recent lesson you want to review or browse through all the reports, use the navigation menu on the left side of your own Nearpod account and select “Reports” from there. This will open a list of all post-session reports, with the most recent lesson at the top. Each lesson can be opened to show the list of reports available for that lesson.
Types of reports
Nearpod reports contain a wide variety of data based on how the lesson is designed. Let’s quickly review the three different types of reports, how they are set up, and some ways you can use the information they provide to make instructional decisions.
Summary
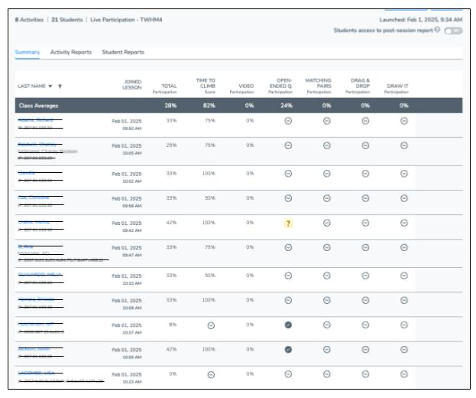
The summary is a general overview of the lesson itself, including the number of activities, the lesson code, and the number of students. It includes a list of all the students and when they joined the lesson, along with a full class view of the general participation.
If an activity has the ability to show a percentage grade, that is shown on the first page as well. You can sort activities by greatest and least participation and grade percentages, or sort by student last names.
Sorting the columns in the summary report can provide insights for future instructional decisions.
Insights from the Summary report
For example, if you sort by total participation, least to greatest, you can quickly see if there are students who simply are not participating at all. This can be helpful, especially if you have a larger class with a couple of strong personalities, as there may be a few students who are flying under the radar during a live lesson. With this information, you can keep a closer eye on those students in future lessons and encourage their participation.
Another option with the summary report is to take a look at the activities that provide a percentage score on questions. There often is a natural break between groups of students who did well, those who did just okay, and those who did not show evidence of understanding. This information can be used to support your decision-making, and you can use this in conjunction with the data from the activity reports (more on that soon) to support students who are struggling.
One new piece of data on the summary page is the indication that feedback or a quick grade has been already provided on a particular activity for specific students. This can provide a quick glance at students you have already addressed or those that require taking another look at their responses. This appears as either a check mark, a question mark, or an x in a square.
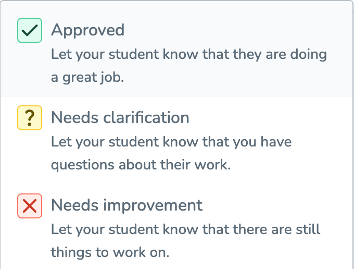
Teachers can also provide feedback during live or student-paced lessons which is then transferred in the summary report. This feedback can come in the form of stickers, written feedback, or as a check mark (“Approved”), question mark (“Needs clarification”), or an X (“Needs improvement”). By providing these quick checkpoints throughout the lesson, students and teachers will have a better understanding of how they are grasping the material being taught.
Activity reports
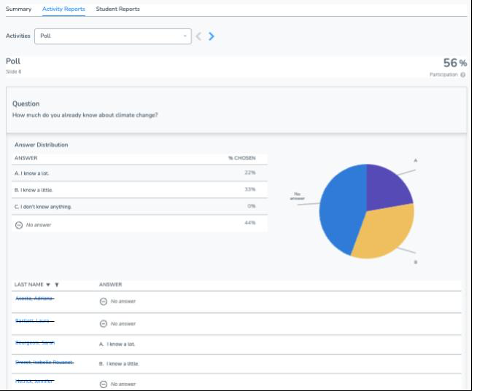
Each activity in Nearpod provides evidence of either learning or lack of learning. You can learn a lot about the type and quality of the question based on activity responses. Some activities, such as the Poll or Collaborate Board, may not have a right and wrong answer but give you a peek into how your students are thinking.
Activities such as Draw It and Drag and Drop have the opportunity for broad responses, allowing multiple inputs including text, images, and drawings. These kinds of activities can support differentiation, giving students the chance to share their thoughts and understanding in a manner that is best for them.
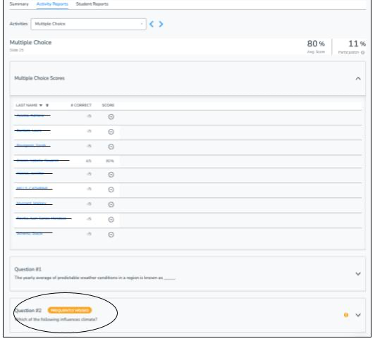
Activities like a multiple-choice Quiz or a gamified Time to Climb quiz have a definite right or wrong response. The report for these slightly more formal assessment activities can indicate if there were questions that were commonly missed and the most common incorrect answers selected. This helps the teacher by quickly indicating that either a skill needs to be retaught, the answer key needs to be checked, or perhaps a question needs to be rewritten.
This information can all be used to determine where the students are in their work towards mastery of a skill or understanding of a concept. This can help you as the teacher make decisions about building support in small groups for intervention, thinking through the next day’s lesson to reteach a missed concept, or accelerating the learning to new material when a class is ready for the challenge.
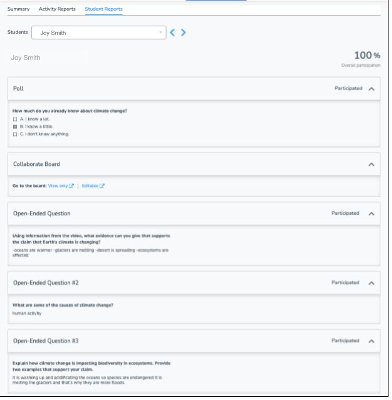
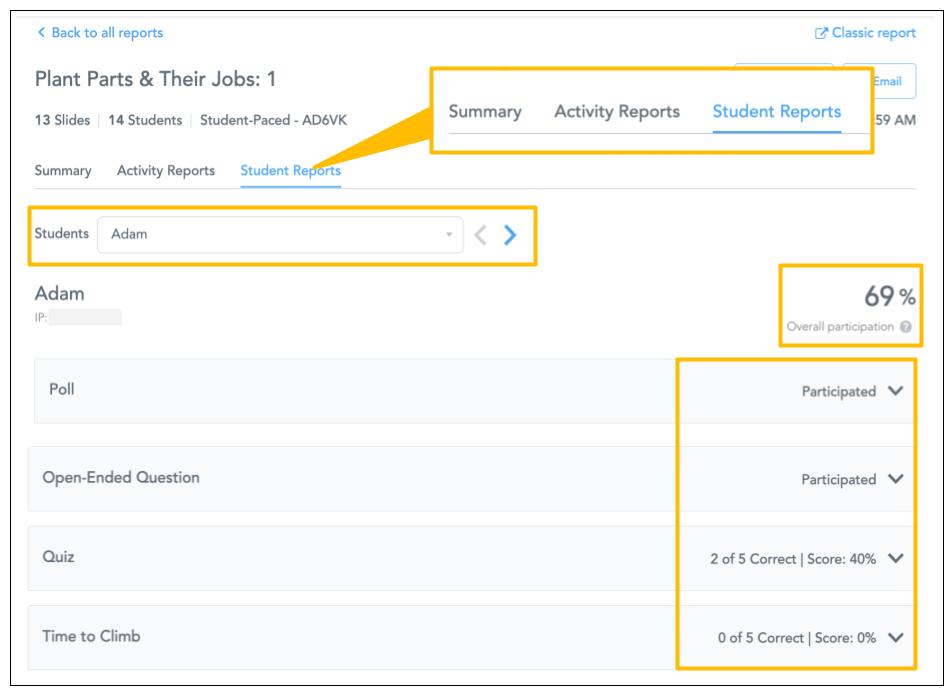
Student reports
Each student who joins a Live or Student-Paced lesson will generate an individual or student report. Student reports include all the same information from the summary and activity report but are separated by the student. This allows for personalized conversations, opportunities for students to reflect on their own efforts, and effective communication with other teachers, administrators, and parents. This information can be downloaded as the entire group who completed the lesson, or individual students can be selected and their reports downloaded as PDFs.
For educators with a school or district license, Student Accounts can be enabled, allowing students to review their own reports after completing a Nearpod lesson. This report is sent directly to their Nearpod account. In the student’s Nearpod account, they can see two types of reports:
- Full lesson report: When students launch a lesson in the role of a teacher, they receive a report that includes data from all participants, just like a teacher would see.
- Individual student report: When students participate in a lesson as a student, they receive a personal report showing their own progress and responses.
How to maximize lesson data from Nearpod reports
Let’s take a moment to explore some of the ways Nearpod reports can be used to improve instruction and support student success.
1. Data-driven instruction
Data-driven instruction is a broad term used to describe the practice of utilizing multiple data points to determine how and what students are learning. This can include information such as assessments, observations, and evidence from recent work to inform the design and teaching of the next instructional lesson, unit, or semester.
Using Nearpod reports as part of this process is beneficial for short cycles of learning, assessment, planning, and teaching. The evidence from these reports provides the most recent and often the most personal and unique evidence of learning. The faster the feedback, the sooner an intervention or support can be provided, and the more likely students will successfully adjust their learning.
Take a few minutes to review a report related to an upcoming lesson. Use that data to consider how a quick reteach at the beginning of that lesson or a vocabulary review might strengthen that next learning experience.
2. Teacher talk vs. student talk
Two pieces of data found in a post-session report are the number of slides and the number of activities in a lesson. At first glance, you might wonder what these simple informational points tell you. While this may not be definitive scientific data, this basic information about a lesson could spark thoughtful consideration about the connection between teacher talk (the number of slides—roughly showing the amount of time you spend talking/teaching) and student talk (the number of activities—roughly showing the amount of time a student spends “talking” or actively engaging with the material). It’s also worth considering if what you see for this lesson is a pattern or an outlier.
We design lessons to provide students with the information and support they need. We try to anticipate every question or learning barrier—but do they always need everything shown to them?
For example, if a lesson includes 25 slides and eight interactive activities, that seems to be a nice ratio of teacher talk to student talk. However, when you consider another lesson, it might show there is only one activity in a lesson that is seven slides long. The questions you should reflect on might include:
- Why is there only one activity in a lesson that is seven slides long?
- What opportunities did my learners have to engage with me?
- What opportunities did my learners have to engage with each other?
Using Nearpod reports to see if there are trends in the ratio of teacher talk to student talk in your lessons can help you consider how to adjust your instruction in a way that could have a high impact on student learning.
3. Rigorous question design
With Nearpod reports, all the questions you have asked your students, and their responses are documented. This gives you an opportunity to reflect on those questions. The questions you ask your students should create an opportunity for them to recall information, apply that information by combining various skills and concepts, and synthesize what they learned with what they already knew.
Gerald Aungst from Edutopia shares an idea to help reflect on questions and activities being used in instruction, writing, “How do we create rich environments where all students learn at a high level? One useful tool, Norman Webb’s Depth of Knowledge Levels, can help teachers meet that challenge. Depth of Knowledge (DoK) categorizes tasks according to the complexity of thinking required to successfully complete them
DoK has four levels, ranging from recall and reproduction (Level 1) to extended thinking and complex reasoning (Level 4). It can be used to ensure your lesson plans and assessments are aligned with the desired learning outcomes.
As you reflect on the questions and activities in your lesson, keep these three questions in mind:
- What is the most common type of thinking my students should be doing?
- What opportunities have I provided, or have I missed, with this question or activity?
- Is this the most effective use of the instructional time I have for this skill or concept?
Use your answers to guide how you build lessons and activities and how you write questions for your next lesson.
Start using Nearpod reports
The evolution of teaching methods from guesswork to data-driven instruction has been transformative. Nearpod’s innovative platform provides educators like you with real-time insights and detailed post-session reports, ensuring that every student is seen and heard and is on the path to mastery. By leveraging this technology, teachers can make informed decisions, tailor their instruction to meet individual needs, and ultimately enhance the learning experience.
Administrators can also access school-level data through Nearpod’s Admin Reports, offering a broader view of student progress and instructional impact. The ability to track and analyze student performance not only supports immediate instructional adjustments but also fosters teachers’ professional growth, making teaching more effective and rewarding.
New to Nearpod? Teachers can sign up for a free Nearpod account below to access these resources, interactive activities, and engaging lessons. Administrators can schedule a call with an expert to unlock the full power of Nearpod for schools and districts.